
Illustration & Data Visualisation — Trajan Scientific
Project Scope & Deliverables
Client: Trajan Scientific Australia
Project Scope: Scientific Data Visualisation, Laboratory Workflow Infographics & Technical Marketing Illustration
Medium & Style: Scalable Vector Illustration & Information Graphic Design (Adobe Illustrator)
Client Location: Melbourne, Victoria, Australia
The Challenge: Simplifying High-Tech Laboratory Workflows
Trajan Scientific approached my Melbourne studio to design a suite of clear, high-impact marketing infographics aimed at laboratory managers, researchers, and scientific professionals. The core objective was to take highly complex, multi-layered analytical workflows and distill them into scannable, visually engaging marketing assets.
The primary creative challenge lay in the precision of the subject matter. When dealing with high-throughput laboratory environments, mass spectrometry, and analytical chromatography, structural accuracy is everything. I had to interpret technical data—ranging from mechanical component interfaces to real-time laboratory downtime metrics—and translate it into an accessible visual narrative. Trajan required an expert infographic illustrator in Melbourne who could grasp intricate industrial processes and deliver clean, polished visual communication that stayed strictly on-brand.
The Solution: Analytical Pipelines, Comparative Data, and Laboratory Timelines
By leaning into my background as one of the established graphic designers and infographic illustrators in Australia, specialising in corporate data visualisation, I bypassed the clinical, text-heavy style typical of scientific data sheets. I designed a cohesive series of technical vector layouts tailored for print distribution and digital B2B marketing channels:
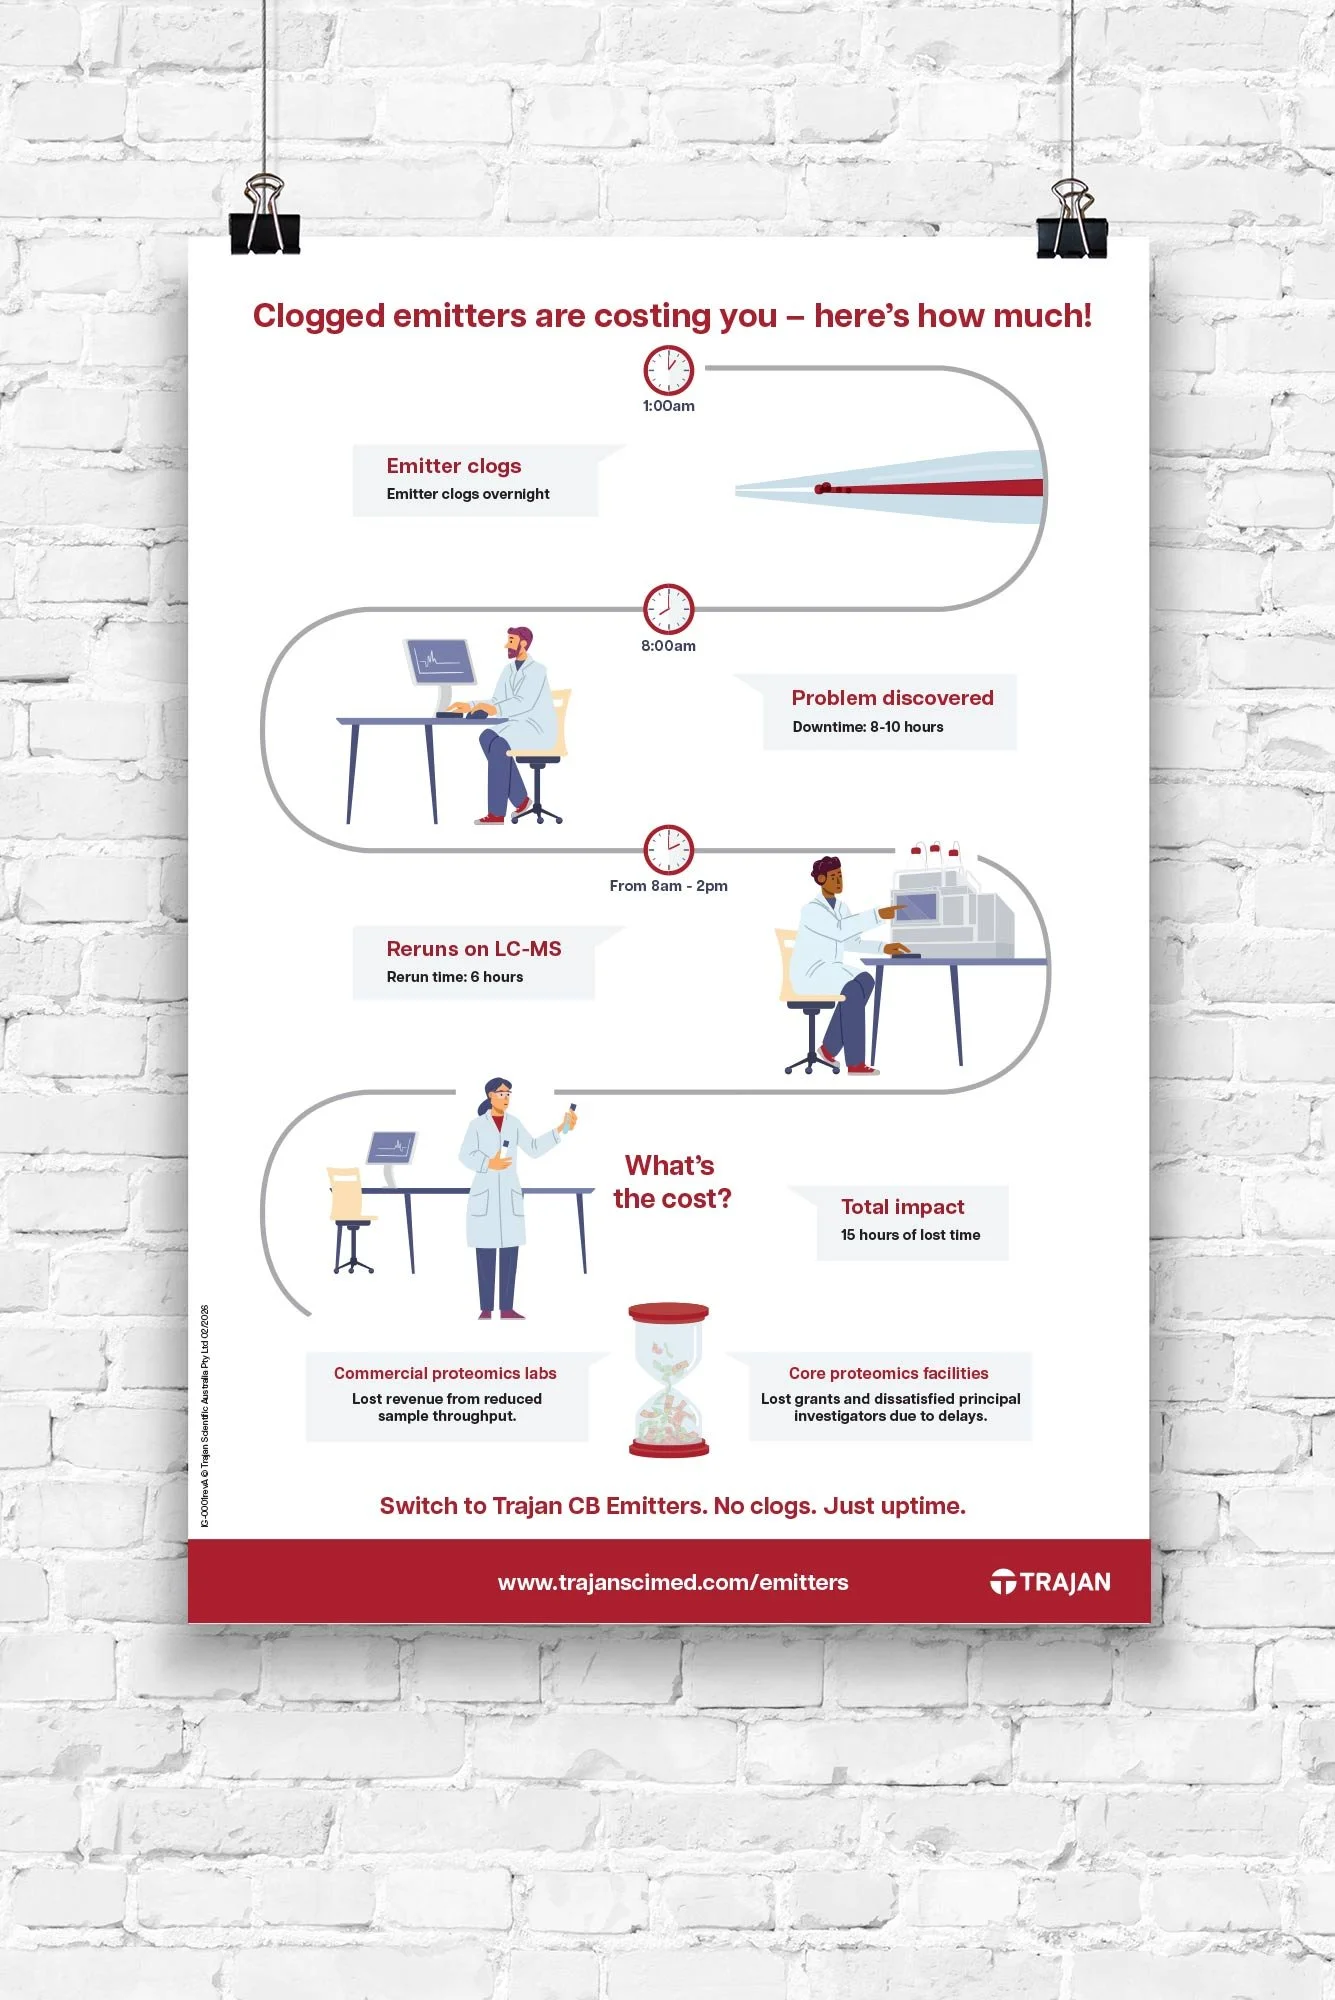
The Clogged Emitters Timeline Infographic: For this high-impact A4 visual narrative, I built a winding, chronological timeline that highlights the unseen financial and operational costs of equipment failure ("Clogged emitters are costing you – here’s how much!"). The graphic traces an escalating laboratory crisis from an overnight emitter clog at 1:00 am, to the problem's discovery at 8:00 am (resulting in 8–10 hours of downtime), through to subsequent 6-hour re-runs on LC-MS instruments. By illustrating relatable character assets—including lab technicians navigating stressful instrument delays—the layout calculates a total lab impact of 15 hours of lost time. It effectively contrasts the vulnerabilities of commercial proteomics labs and core facilities against the ultimate solution: switching to Trajan CB Emitters for guaranteed uptime.
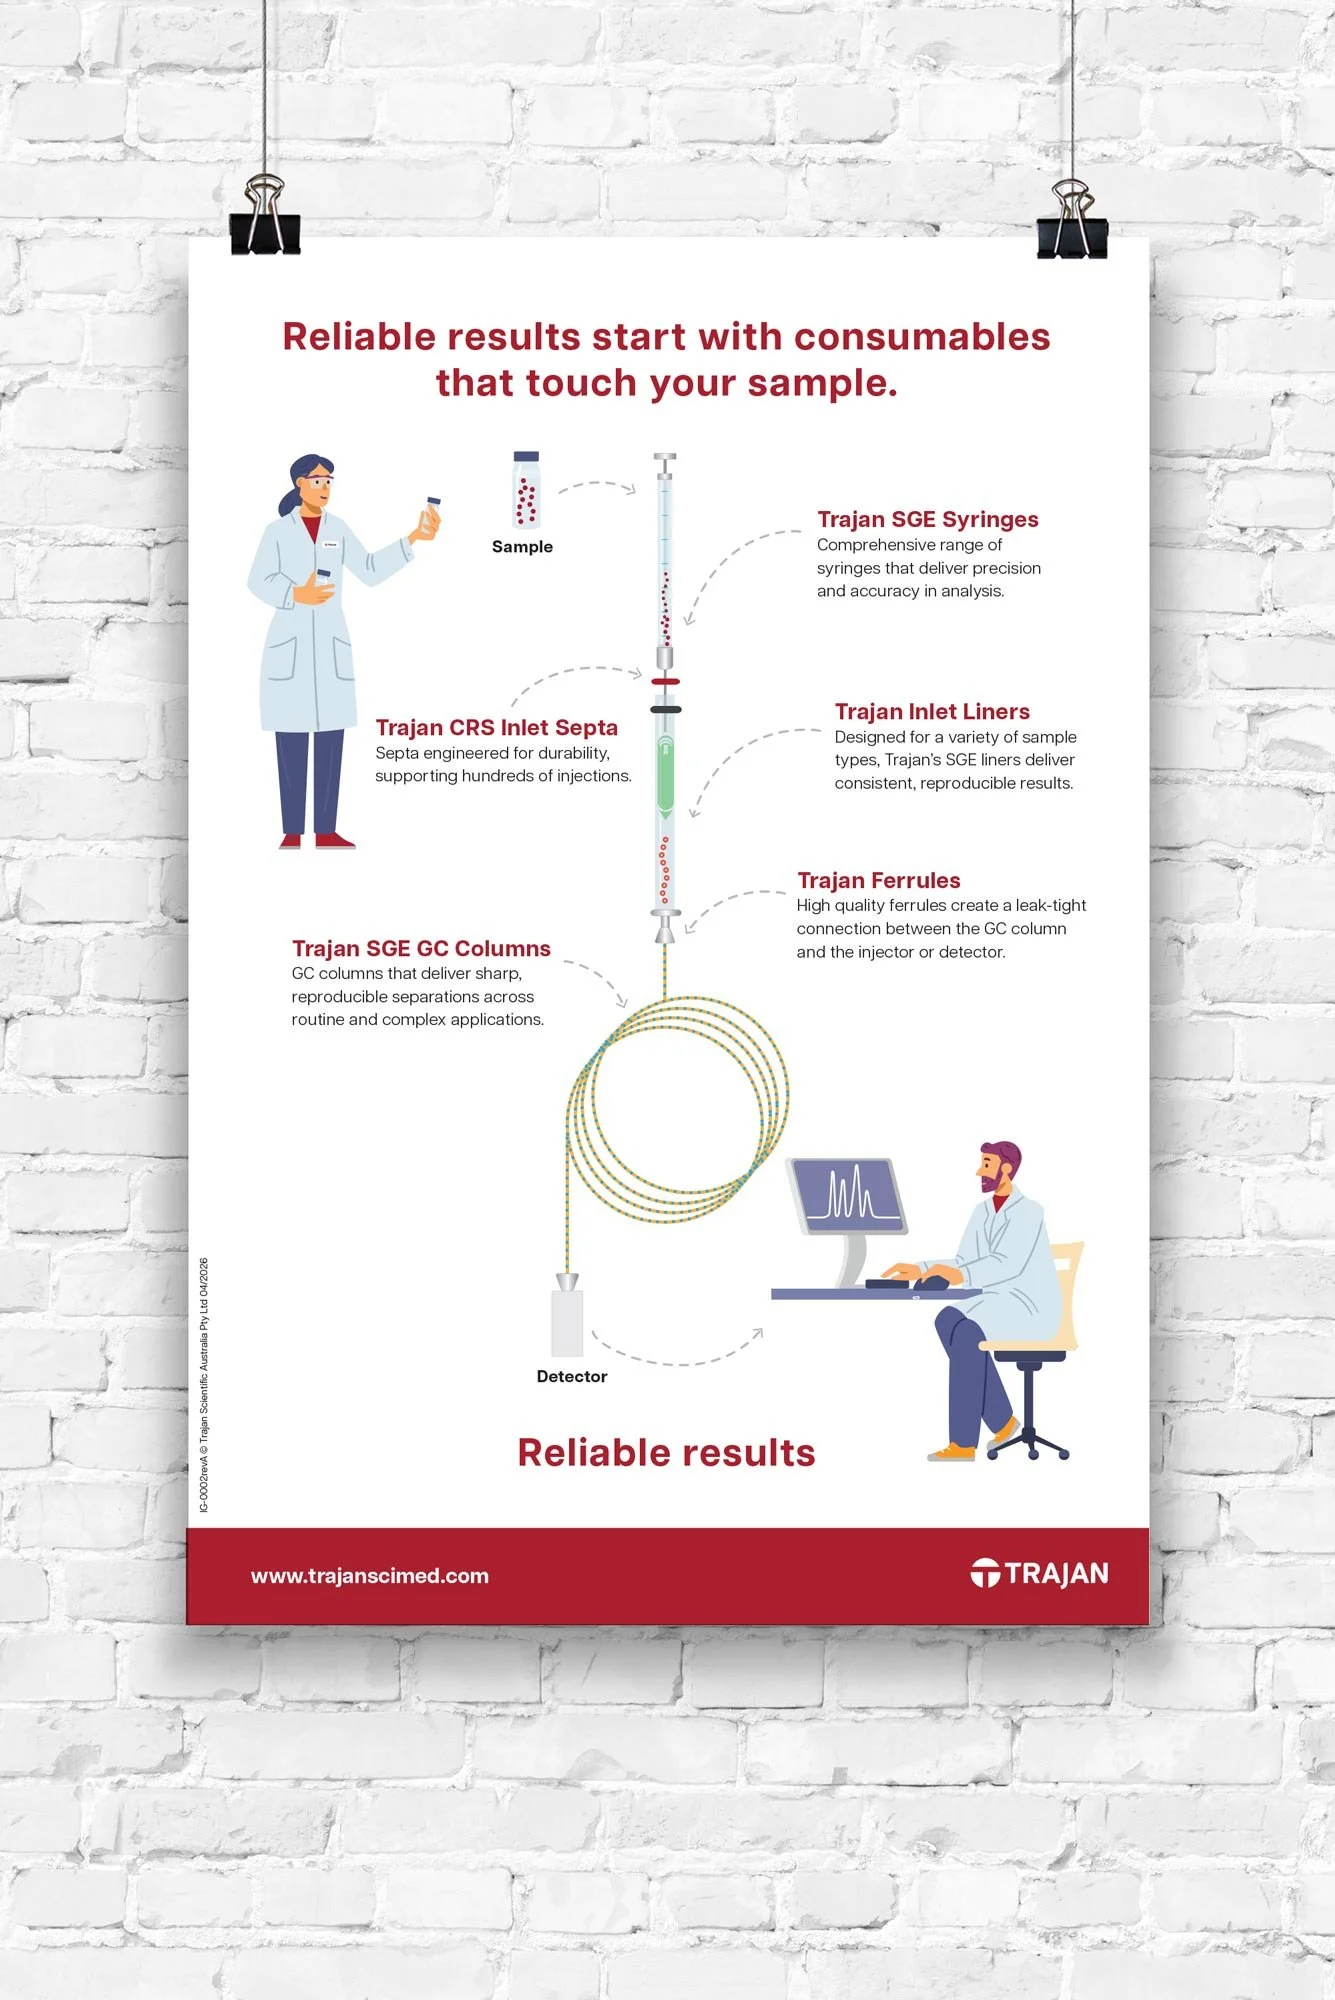
The Consumables Pipeline Infographic: For the next asset in the suite, I built a linear workflow diagram mapping the precise, sequential path a sample takes through laboratory instruments. Anchored by the core message that "reliable results start with consumables that touch your sample," the graphic seamlessly tracks a specimen's journey through a chain of precision components—including syringes, inlet septa, liners, and columns—directly into the detector. By deploying clean vector iconography and a clear, left-to-right visual pipeline, the illustration simplifies an advanced technical process into an approachable product ecosystem map.
The Result
This "digital-artisan" approach to complex information design successfully translated rigorous scientific data into a human-centred marketing toolkit. By synthesising technical mechanics with dynamic character illustration and clear typographic hierarchies, the final infographics operate as production-ready, highly persuasive sales assets that present Trajan's sophisticated engineering with absolute visual clarity.